Thanks for attending my workshop!
Here are some selected slides for your reference (PDF)
My Book:
- Measures of Success: React Less, Lead Better, Improve More
- Available as paperback or eBook
- Excel template for Process Behavior Charts and more
- More resources via the book's website
Deeper Dive Topics
Question: Why not use Other Types of Control Charts?
Question: Do the data have to be normally distributed for Process Behavior Charts to be valid?
Question: Why is there a Scaling Factor for the Upper and Lower Natural Process Limits?
PBC Case Studies
Donald J. Wheeler Information
- Dr. Wheeler's book Understanding Variation
- A deeper dive book Making Sense of Data
- His website
- An interview with Dr. Wheeler
- Scaling Factors for Process Behavior Charts — A Quick Reference Guide
Webinar and Video Tutorial on Creating Process Behavior Charts:
Dr. Deming Red Bead Videos:
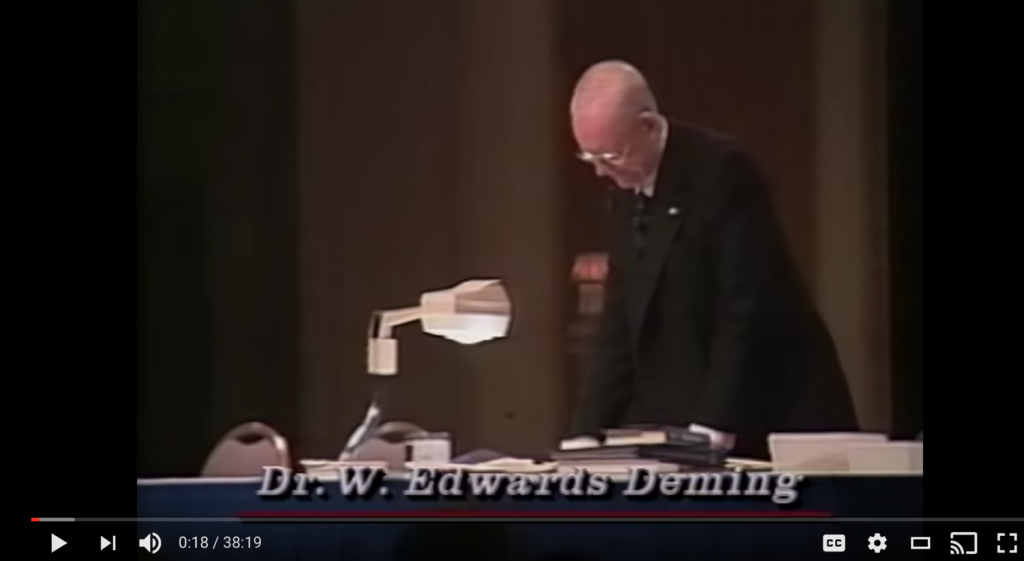
More on Deming:
A webinar that I presented with Mike Stoecklein for Catalysis:
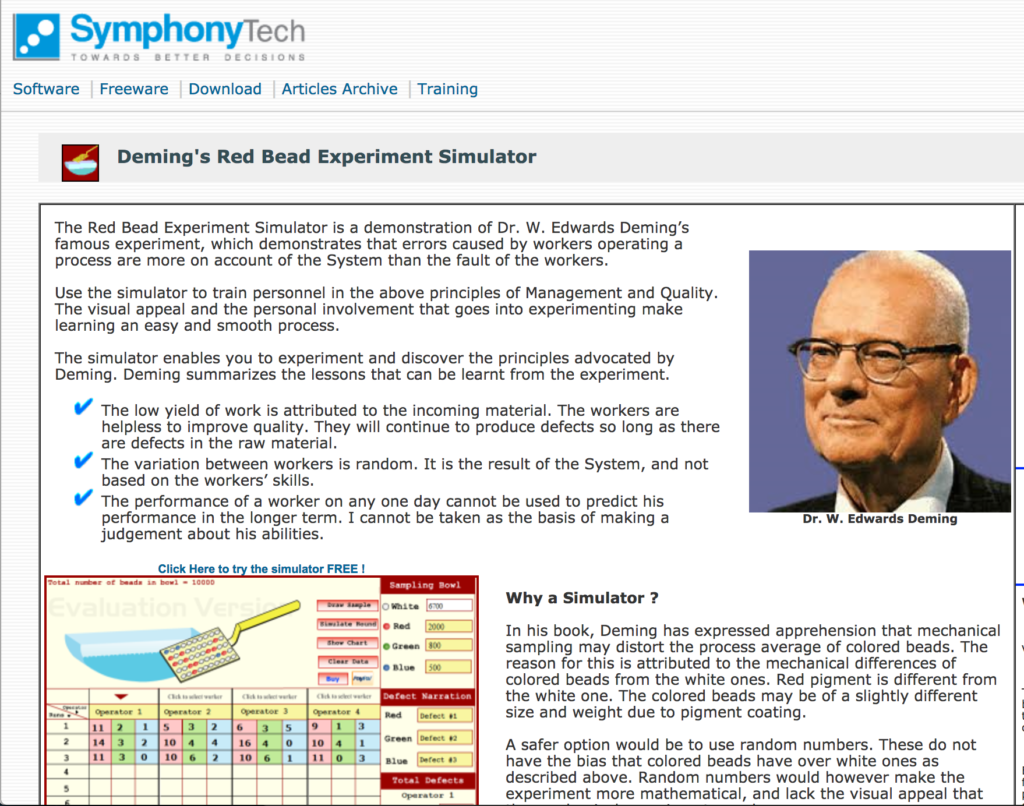
Red Bead Simulator Online:
Click here or the photo below: