
Thanks for attending my workshop!
Here are some additional resources.
Donald J. Wheeler Information
- Dr. Wheeler's book Understanding Variation
- His website
- An interview with Dr. Wheeler
Video Tutorial on Creating Control Charts (Process Behavior Charts):
Dr. Deming Red Bead Videos:
More on Deming:
A webinar that I presented with Mike Stoecklein for Catalysis:
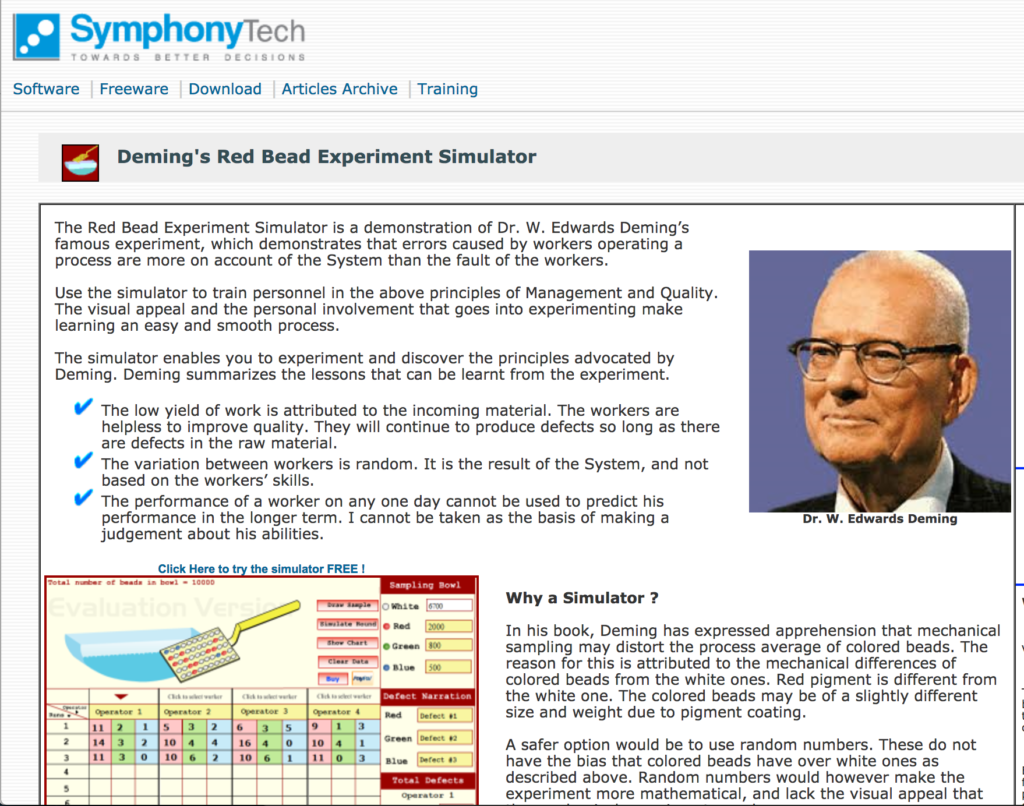
Red Bead Simulator Online:
Click here or the photo below:
Blog Posts on This Topic of Understanding Variation:
Running Dr. Deming's Red Bead Experiment & the Implications for Healthcare
Free Webinar Recording: The Real Lessons of Dr. Deming's Red Bead Factory
Your “Lean Daily Management” Approach Would Be Even Better with Some Simple Statistical Methods
Meeting A Professional Hero: Donald J. Wheeler, PhD, of “Understanding Variation”
Better Metrics & “Understanding Variation” – An Important Topic for Healthcare
Why Red-Green Charts in Management are a Rear-View Mirror Approach
What's Demoralizing? The Colors on a Chart or Not Improving the System?
Data Without Context Isn't Very Helpful; Don't Overreact to Each Up & Down