
Metrics keynote – Mark Graban
React less. Improve more.
Keynotes, fireside chats, and workshops for leaders who review performance metrics. How to tell signal from noise, so your reviews spend time on what actually changed.
One row, two stories
The book behind the talks
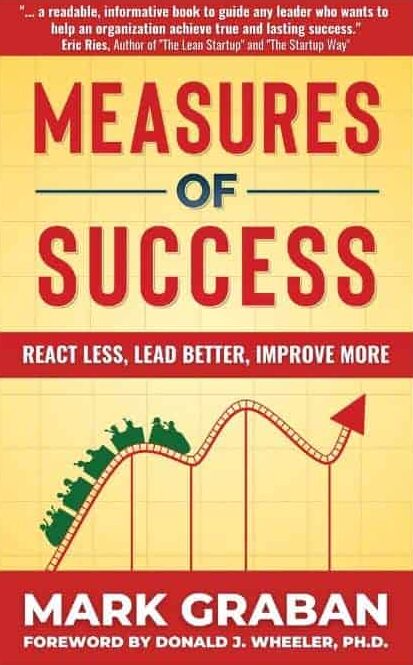
Measures of Success: React Less, Lead Better, Improve More
By Mark Graban, with a foreword by statistician Donald J. Wheeler
“…everyone who is exposed to business data of any type needs to read this book.”Donald J. Wheeler, author of Understanding Variation
The Problem in Most Metric Reviews
This month is compared to last month. A number goes from green to red, and someone gets asked to explain it. A number goes from red to green, and the team gets congratulated for working harder. Next month, it happens again.
Most of those ups and downs are noise: the normal variation of a system that hasn’t changed. Explaining them burns leadership time and credibility. Worse, the color coding can hide what matters. A metric can be red every month and still be improving, or green every month while quietly getting worse.
My talks give leaders a practical way out of that cycle, using the same scorecards and bowling charts they already review.
What Your Leaders Take Away
- Why two data points aren’t a trend, and why “better than last month but worse than last year” tells you almost nothing.
- Three simple rules for finding real signals with Process Behavior Charts, so you know when to react and when to step back.
- Not all reds are created equal. The same number can be a signal for one team and noise for another.
- Improve the system instead of explaining noise. When a metric is stable but not good enough, the work is changing the process, not asking what went wrong this month.
- Are we fooling ourselves about improvement? How to tell whether a change really worked, and why “the team didn’t sustain it” is often the wrong diagnosis.
“The discussion was insightful… We all left feeling empowered with the knowledge you shared and the perspective you offered.” — Gauri Shanbhag, Sr Sourcing Manager, GE Aerospace
“Mark Graban taught the KaiNexus team how to understand the story a metric is actually telling over time. We’ve saved time by not overanalyzing every up and down in our metrics — and that’s valuable time we now put to better use.” — Dr. Greg Jacobson, CEO and Co-Founder, KaiNexus
“Mark Graban connects two things plant leaders need most: a better way to read metrics and a better way to respond when things go wrong. His workshops are practical, grounded, and free of buzzwords. Teams walk out with tools they can use right away.” — William Harvey, Multi-Site Plant Manager, Specialty Chemicals
Measures of Success Talk Topics
Each topic can be a keynote, a fireside chat, or part of a workshop.
React Less, Improve More: Distinguishing Signal from Noise in Metrics. Leaders have limited time and still need an accurate read on performance. Simple statistical methods help them stop overreacting to normal ups and downs, stop asking teams to explain noise, and spend review time on what actually changed.
Beyond Red and Green: What Your Scorecard Isn’t Telling You. Bowling charts and red-and-green scorecards answer one question: did we hit target this month? They can hide a metric that’s red but improving, or one that’s green but quietly getting worse. This session shows how to keep the scorecard and add what it’s missing.
Are We Fooling Ourselves About Improvement? Before-and-after comparisons and linear trend lines make it easy to declare success. This session shows how to tell whether a change really worked, and why “the team didn’t sustain it” is often the wrong diagnosis. It pairs well with my work on psychological safety.
The Red Bead Experiment. A hands-on session based on W. Edwards Deming’s classic. Participants watch the same process produce different results, and see why rewarding or blaming people for that variation changes nothing.
Formats
Keynote (45-60 minutes). Signal or Noise? React Less, Lead Better, Improve More. An interactive talk built around a familiar red-and-green scorecard. The room makes its calls first, then sees what the charts actually say.
Fireside chat. A moderated conversation with a leader from your organization, using your own reporting habits as the starting point, followed by audience Q&A.
Workshop (half day). Leaders build Process Behavior Charts from their own metrics and experience variation firsthand through Deming’s Red Bead Experiment. See the full workshop agenda.
I’ve led these workshops across the United States and in Canada, Belgium, the Netherlands, Brazil, and Ireland, and facilitated the Red Bead Experiment at Lean Startup Week and Society for Health Systems conferences.
“Made a dry subject (data) engaging. I wasn’t ready for the class to be over at the end of the day.” — Workshop participant, Lean Healthcare Transformation Summit
Sessions can be combined with my work on psychological safety. People won’t show honest data if they expect to be punished for a red number.
Who It’s For
Executives and managers who run performance reviews, along with operations, quality, safety, finance, and continuous improvement leaders. The methods apply to any metric tracked over time, in manufacturing, healthcare, and knowledge work alike, not just on the shop floor.
About Mark Graban

I’m the author of Measures of Success: React Less, Lead Better, Improve More, which teaches leaders to apply Process Behavior Charts, a method popularized by statistician Donald J. Wheeler, to the metrics they review every day. I’m also the author or co-author of Lean Hospitals, Healthcare Kaizen, The Mistakes That Make Us, and the forthcoming The Silence Tax.
I started my career as an industrial engineer at a General Motors engine plant and have since worked with organizations in manufacturing, healthcare, and technology. I hold a B.S. in Industrial Engineering from Northwestern University and an M.S. and MBA from MIT.
Let’s Talk About Your Event
Contact me about speaking to discuss your goals, or download the metrics one-sheet (PDF) to share with your team.
Free resources: What Your Scorecard Isn’t Telling You (a guide to bowling charts), Measures of Success talk resources, and a free sample chapter.
See all of my speaking topics, or learn more about my keynotes on psychological safety and learning from mistakes.